You can view a recorded presentation of my climate change talk here.
Well, to start – climate and weather are not the same thing!
Weather is the day-to-day change in conditions at a certain place, while the climate is the trend of that place’s weather over time. In other words, climate is what you expect, but weather is what you get. A change in the weather that consistently trends in a certain direction will average out to a change in climate over time. Generally, the weather of the past 30 years at a place is averaged to calculate its climate. For climate models and projections, when a warming of 1.5C is discussed, it is the average climate of the period between 1950 and 1981 that is being used as the baseline.

Dr. Tyson walking on a beach in relatively straight line represents the trend of the climate, while the leashed dog walking erratically back and forth represents the weather that varies over a shorter time scale.
The terms “climate change” and “global warming” have been used interchangeably, but the globe isn’t warming uniformly everywhere; for example the Arctic region is warming more than four times faster than the global average. Further, not all climate change events in earth’s past resulted in warming trends. It would be more accurate to call our current situation “global climate destabilization”.
Climate change is simply a redistribution of heat around the globe.
Earth’s climate is influenced by four factors:
These four phenomena interact in complex ways that all contribute to Earth’s climate.
The total energy reaching Earth’s surface from the Sun varies due to changes in Earth’s axial tilt, the procession or “wobbliness” of the Earth on its axis, the shape of the Earth’s orbit around the sun. Collectively these are called Milankovich cycles. It also depends on the amount of energy coming from the sun due to its 11-year sunspot cycle.

Changes in Earth’s albedo are complex and vary seasonally and even day-to-day. Bright, high-albedo surfaces such as snow, ice, and clouds reflect much of the sun’s energy back into space, while dark, low-albedo surfaces such as ocean and forest absorb it. The earth’s albedo can also be affected by changes in the atmospheric composition, or Milankovich cycles.
The movement of the continents has a significant effect on climate, but it happens over very long timescales (e.g. tens of millions of years).
Changes in the composition of Earth’s atmosphere can result from a variety of phenomena. GHGs are released during volcanic eruptions and forest fires, and they are absorbed by living things and cycled into the earth’s crust very slowly during the process of erosion.
Earth’s atmosphere has changed throughout time, but today it is 78% nitrogen, 21% oxygen, and 0.93% Argon. A tiny 0.043% is comprised of the “greenhouse gasses” or GHGs: nitrous oxide (N2O), methane (CH4), carbon dioxide (CO2), and water vapor (H2O, aka clouds). Most of it is in a 16km-thick layer around the Earth.
GHGs insulate the earths’ surface, keeping the sun’s heat from escaping back into space too quickly. This is called the “greenhouse effect”.
An excellent short video explaining Earth’s greenhouse effect.
This giant molecular photon pinball game results in a global average surface temperature of 59°F (15C). Even though GHGs make up such a tiny fraction of a percent of our atmosphere (seen as “parts per million”, or PPM), it has a disproportionate effect on Earth’s climate. Without GHGs, the average temperature of the earth would be a frosty and inhospitable 0°F (-18C)! This isn’t a new discovery. Scientist Joseph Fornier first described the greenhouse effect in 1824!
It’s easy to see how even an objectively tiny increase in GHGs would result in a disproportionately large increase in Earth’s average temperature. Since 1880, we have observed a global average temperature increase of 2F (1.1C). Learn more here.
The GHG we’re most concerned with today is CO2, carbon dioxide. Prior to the industrial revolution, Earth’s CO2 level had not risen above 300 PPM for the past 800,000 years – longer than the our species, Homo sapiens, has existed! Once the industrial revolution began around 1760, atmospheric CO2 began to rise – slowly at first, but it has been accelerating. Due to the complexity of the Earth’s carbon cycle, it can take hundreds to thousands of years for a CO2 molecule to be taken back up by natural processes. Once it’s in the atmosphere, as far as humans are concerned, it’s probably going to be up there functionally forever – unless it’s removed artificially.
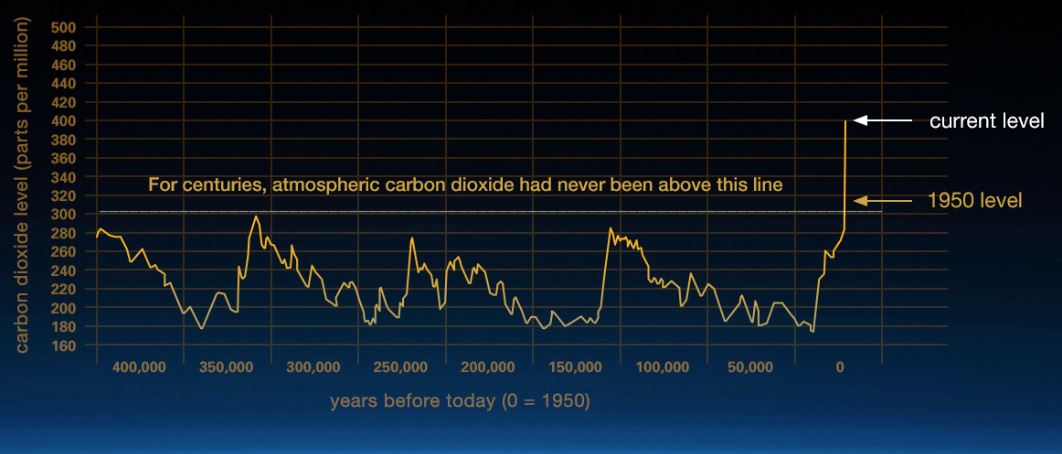
A graph of atmospheric CO2 levels from ice core data spanning the past 400,000 years. It shows a level ranging from 180 – 300PPM with time moving from left to right, until nearly a vertical increase on the far right side of the graph in the present.
As of February 2021 we had reached a monthly average of 416PPM of CO2, an increase of 27% over the historic 300PPM level, in a geological eyeblink. You can see today’s level here.
These four factors above, alone or interacting in complex ways, cause long-term shifts in weather patterns that over time change in the Earth’s climate. Climate change throughout earth’s past has led to catastrophic species loss (i.e. extinction events); to be considered a mass extinction, at least 75% of known life must go extinct. We know of 5 such mass extinction events, dubbed “The Big 5” by quantitative paleontologists Jack Sepkoski and David Raup at the University of Chicago in 1982. Since then, evidence for one additional mass extinction has been uncovered – around 350 million years ago, called the Guadalupian Extinction.

The five major mass extinctions widely recognized in the Phanerozoic geologic record: the Ordovician (443.8 Ma), the Devonian (372.2 Ma), the Permian (251.9 Ma), the Triassic (201.4 Ma) and Cretaceous or K-T (66 Ma).
Each of these mass extinctions coincide with catastrophic changes in atmospheric chemistry (GHGs) and/or climate. They were all preceded by long periods of ecological stress, and half of them took place relatively slowly in pulses that lasted tens to hundreds of thousands of years.
In the present day, the release of greenhouse gasses from human activity is influencing the Earth’s climate. The burning of fossil fuels has contributed 66% of the observed increase in GHGs in our atmosphere. Agriculture and forestry produces a 44% increase, but also absorbs or “offsets” 20% of the CO2 it emits; and the act of extracting the raw materials to make fossil fuels contributes another 10%.

The effect of all this extra CO2 is that the planet’s average temperature is increasing each year. Measurements of CO2 have been collected at Mauna Loa since 1958, and temperature records go back even further to the late 1800s. Prior to that, isotope ratios in carbon, oxygen, and hydrogen atoms in ice cores are used to give a proxy for temperature data from up to a million years ago. Atmospheric carbon dioxide is now being measured in many places all over the world, and although the measurement vacillates up and down due to the yearly occurrences of spring and fall, the upward trend is clear. Carbon dioxide is increasing, and the planet is warming at a breakneck speed, and the two are directly linked.
The last month in which the average temperature was at or below normal was September of 1992. All other months since then have been above average.
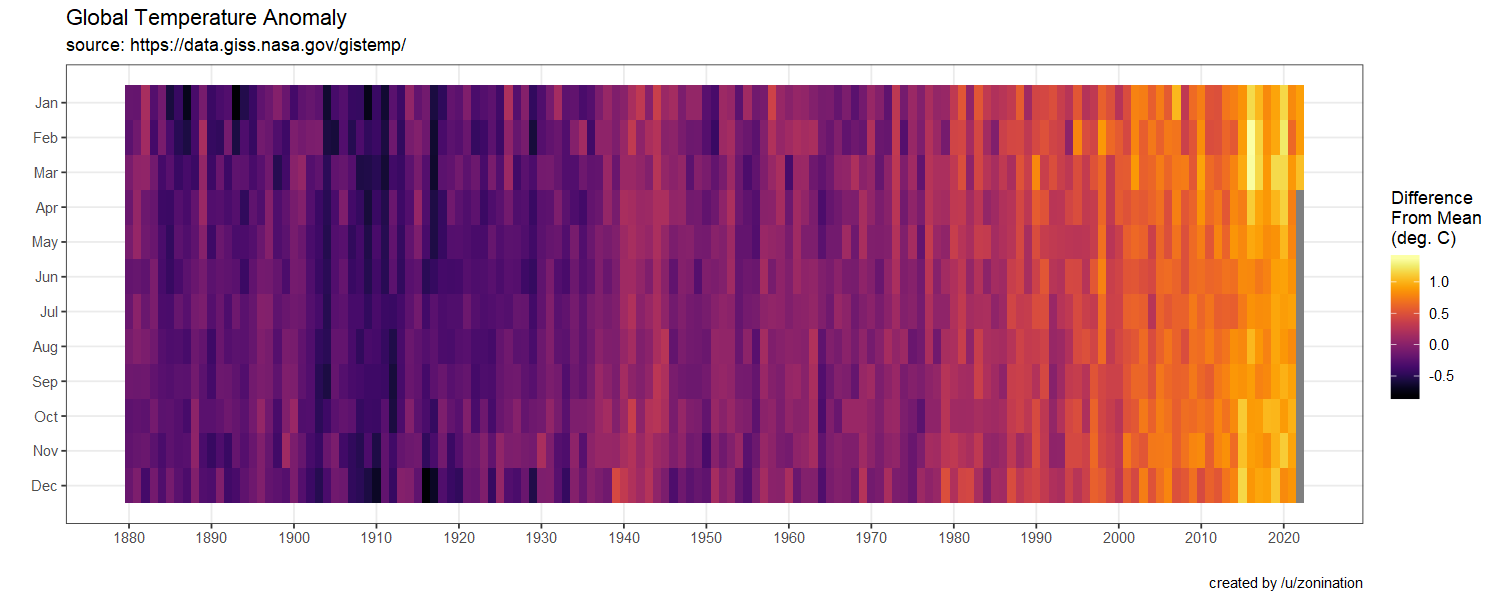
A purple-to-yellow color block graph of the average temperature of each month for the years 1880 to present, showing mostly purple and pink (cool) hues prior to 1940, and mostly orange and yellow (warm) hues after 1990. Updated April 2022.
To find out, let’s take a closer look back at the Devonian (419 – 359 million years ago) and aptly named Carboniferous (359 – 299 million years ago) periods.
The Devonian Earth would be unrecognizable to us. The land now known as Ohio was located about 800 miles south of the equator, and was mostly covered by sea. The days were 22 hours long, but a year was 400 days long. The climate was hot, windy, and tropical, and it had no ice caps. The oceans were filled with life– an incredible diversity of strange and beautiful armored fish, including placoderms (such as our state fossil fish, Dunkleosteus), mollusks, corals, echinoderms, and swimming arthropods – much of it unlike anything alive today. The Devonian is sometimes called “The Age of Fishes”.

Ohio is known for its excellent Devonian fossils. This Dunkleosteus terrelli specimen, named “Dunk”, was found in the Big Creek Valley, Cleveland area between 1965-67 and is on display at The Cleveland Museum of Natural History Photo credit: Flickr user James St. John
Early in the Devonian there was little life on land, but this changed quickly as plants of the time, relatives of today’s ferns, exploited the new niche. Treelike ferns evolved and the land was eventually covered by swamps and rainforest, and surrounded by warm, shallow seas teeming with trilobites and other marine life. Over millions of years, the Earth’s climate slowly cooled as plants gobbled up CO2, and ice caps formed. Dominant land vertebrates – ancestors of today’s amphibians – only started crawling out of the water towards the end of the Devonian.

An artist’s depiction of a Carboniferous forest showing large, fernlike trees and horsetail ferns, fallen trunks, and a large dragonfly in flight
Over the next 60 million of years of the Carboniferous, “The Age of Amphibians” plants grew, died, fell, and were replaced by new plants. Vast swathes of tropical forest covered the only two continents. As the burgeoning plant life produced oxygen, it continued slowly absorbing the CO2 in the atmosphere, locking it up as cellulose in their trunks and leaves. Layer upon layer of dead plants were laid down and slowly buried by sediment and the plants above them, locking their carbon up in the Earth’s crust. Over many millions more years of the coming periods, buried plant remains of the Devonian and Carboniferous were compressed and heated by the movement of earth’s crust until they were turned into carbon-rich shale and coal deposits.

A timeline showing the diversity of life on Earth and the effect of extinction events throughout the last 600 million years
By the end of the Carboniferous, Earth’s first scaled reptiles and amniotic eggs had evolved, and the Permian period, the Age of Reptiles, began. After 50 million years of relative stability and great evolutionary strides, the Permian ended with a bang: the biggest extinction in Earth’s history, an event that wiped out the trilobites as well as 95% of all other marine life, and 70% of life on land. The oceans acidified, and entire orders of animals went extinct – including the trilobites, which had survived two previous mass extinctions and had been flourishing in earth’s shallow seas for nearly 250 million years. It’s often called “The Great Dying”.
There are many theories about what caused the Permian extinction, but what we know is that a 100,000-year-long period of massive volcanism in what is now Siberia and China pumped out enough magma to cover the entire Earth to a depth of 20 feet and released an enormous amount of greenhouse gasses. Today this area is called the Siberian Traps. It was recently discovered that trapped magma stills heated up carbon-rich sediment, releasing huge amounts of greenhouse gasses into the atmosphere, following a protracted period of volcanic activity. This theory is supported by multiple lines of evidence.

This is the Augustine volcano in the Aleutian Islands, Alaska, U.S. It is not personally responsible for the Permian Extinction. Photo credit: Cyrus Read Geophysicist USGS, Alaska Volcano Observatory/Wikipedia Commons
Scientists support this theory because ratio of stable carbon isotopes in the rock layers changed in the 1 million years surrounding the extinction, with C12 becoming unusually common. Plants preferentially use C12 for their metabolism, so this means the main source of carbon in the geologic layers came from plants, corroborating one theory that Carboniferous coal seams were ignited. It’s widely recognized as the biggest natural disaster in Earth’s history.
Geologically speaking, we’re now repeating the event that led up to the Permian Extinction event by releasing the remaining buried Devonian and Carboniferous carbon into the atmosphere all at once. Even the peak of carbon emissions from the Siberian Traps (about 0.7 GtC per year) was 14 times less than our current rate of emissions (9.9 GtC per year) – which are still increasing.
The earliest records of recorded temperature only go back a few hundred years, so to construct Earth’s past climate we rely on something called proxies, or indirect records of climate imprinted on different parts of the biosphere. These include elemental isotope data, ice cores, tree rings, and more.
First, what are isotopes? They’ve been mentioned several times, but what are they, exactly?
The American Chemical Society has a great explanation:
Now that we have a better handle on what isotopes are, what is the science behind using isotopes to figure out Earth’s past climate? NASA’s Earth Observatory has an excellent explanation about how oxygen isotopes can tell us about Earth’s past climates here.

Measuring oxygen isotope ratios in geologic formations gives us a proxy for Earth’s climate through time, and show warm periods vacillating with cold glacial periods. Credit: CC BY-SA 3.0, https://commons.wikimedia.org/w/index.php?curid=184098
Finally, how well do carbon dioxide levels throughout Earth’s more correlate with changes in temperature?
As it turns out, they are very strongly correlated.

Deuterium ratios match very closely with CO2 increases and decreases
Where did this data come from? Tiny bubbles of air trapped in ice cores! Check out this video:
The Byrd Polar Institute at the Ohio State University also does ice core research! Learn more here.
For an excellent look at climate proxies, see Carbon Brief’s interactive tool here. It’s well worth the visit!
And finally, earlier this month NASA scientists published the results of analyzing decades of satellite data, giving us something that was indirectly confirmed by climate models but had never before been possible to measure: direct evidence that heat is building up beneath the Earth’s atmosphere due to human activity.
Some may argue that climate change is natural, and climate change has indeed been a result of natural processes in the past. What’s different about this time is the rate at which it’s occurring, and that we as a sentient species have the ability to stop and reverse it. Human activity certainly is the cause of climate change and we bear the responsibility to address it, but whether the current climate crisis is natural or human-caused is actually irrelevant. The only question is whether to do something about it, which should hopefully be easy to answer. After all, asteroid strikes are natural in origin, but stopping an asteroid from striking the earth would surely be the preferred course of action!
Part II of this two-part blog series can be found here.